⚽️ What's working in FIFA World Cup marketing this year?
GET THE REPORT6 benchmarks to put your consumer research in context

Good data tells a story.
But a single data point on its own doesn’t have much to say.
Imagine your colleague mentions that their latest LinkedIn post got 5,000 views. That sounds like a pretty high number, right? But what you don’t know is that their typical post gets 10,000 views. And your other colleague’s posts regularly get 25,000. Now that 5,000 number doesn’t sound too great!
That’s because without anything to compare it to, a number on its own lacks real meaning — or at least lacks the context you need to decide what to do next.
This concept applies in consumer research too. When you get consumer feedback on an ad or product concept, you end up with a lot of different scores. Overall appeal, consideration, uniqueness — you need all these numbers to help you understand whether your ad will land or if your product will be purchased. But they are tough to interpret on their own.
Let’s say you were trying to get feedback on a rough cut of an ad your team is working on and you saw these numbers.
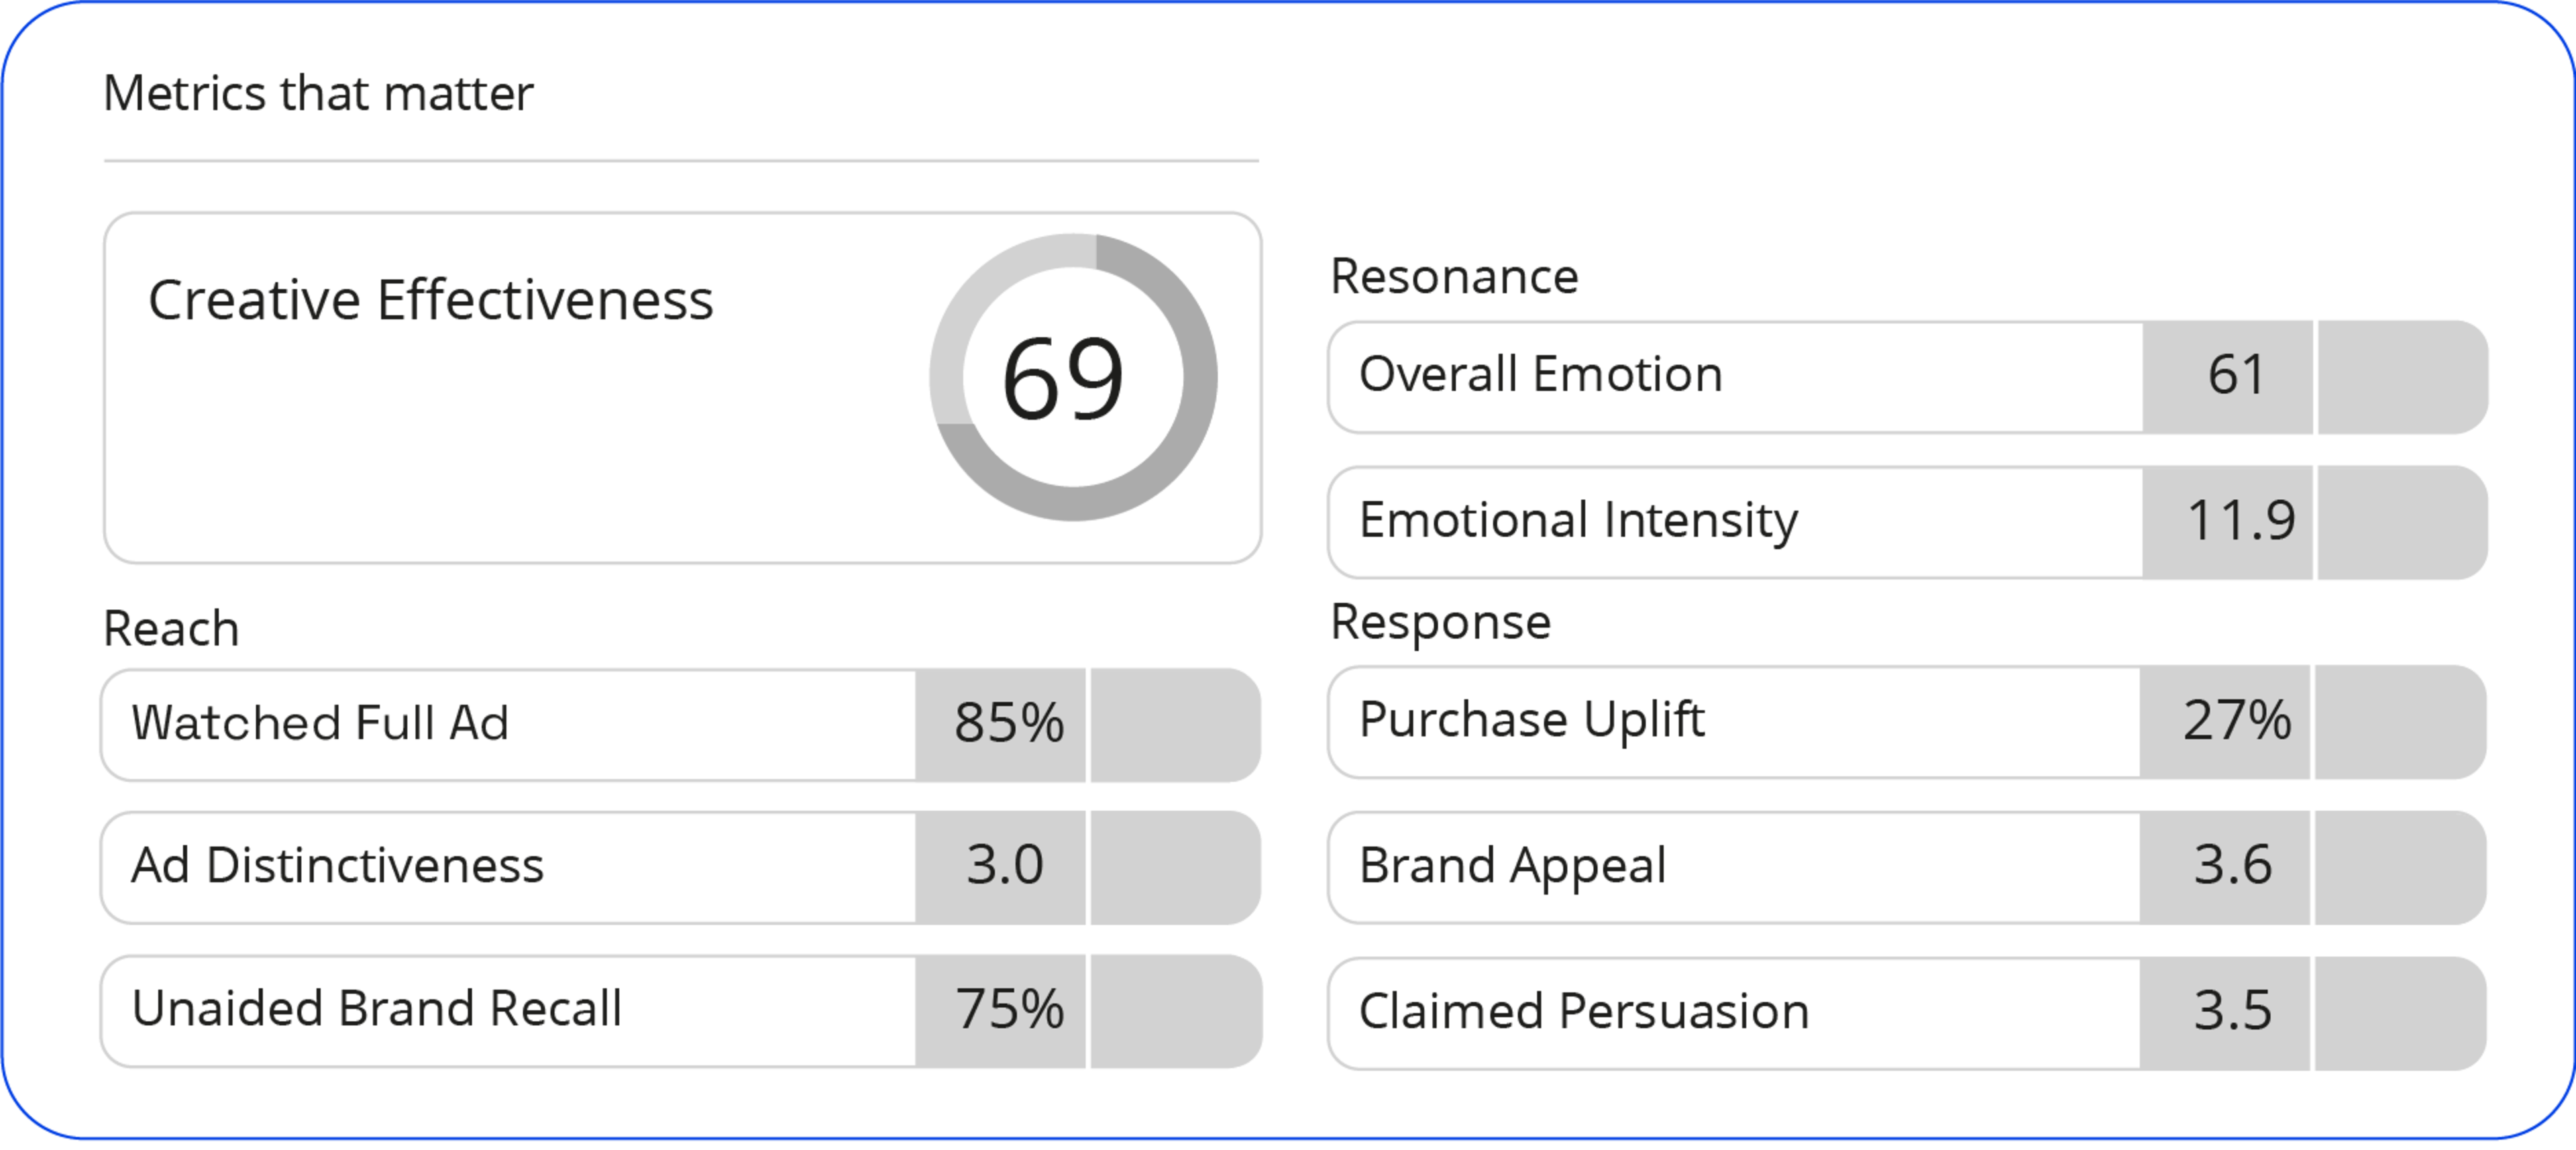
What does 27% for purchase uplift mean? What about 3.6 for brand appeal? Is it breaking records? Do you need to throw the whole thing out and start again?
But what if you saw these numbers instead? Now you see this ad scored in the top third of all the ads in the category. But it could be further optimized by improving emotional intensity (how much the ad elicits emotions throughout/at each second) and how well the ad holds attention till the end (from watched full ad we see only 85% of people watched the full ad, the rest skipped before the end).
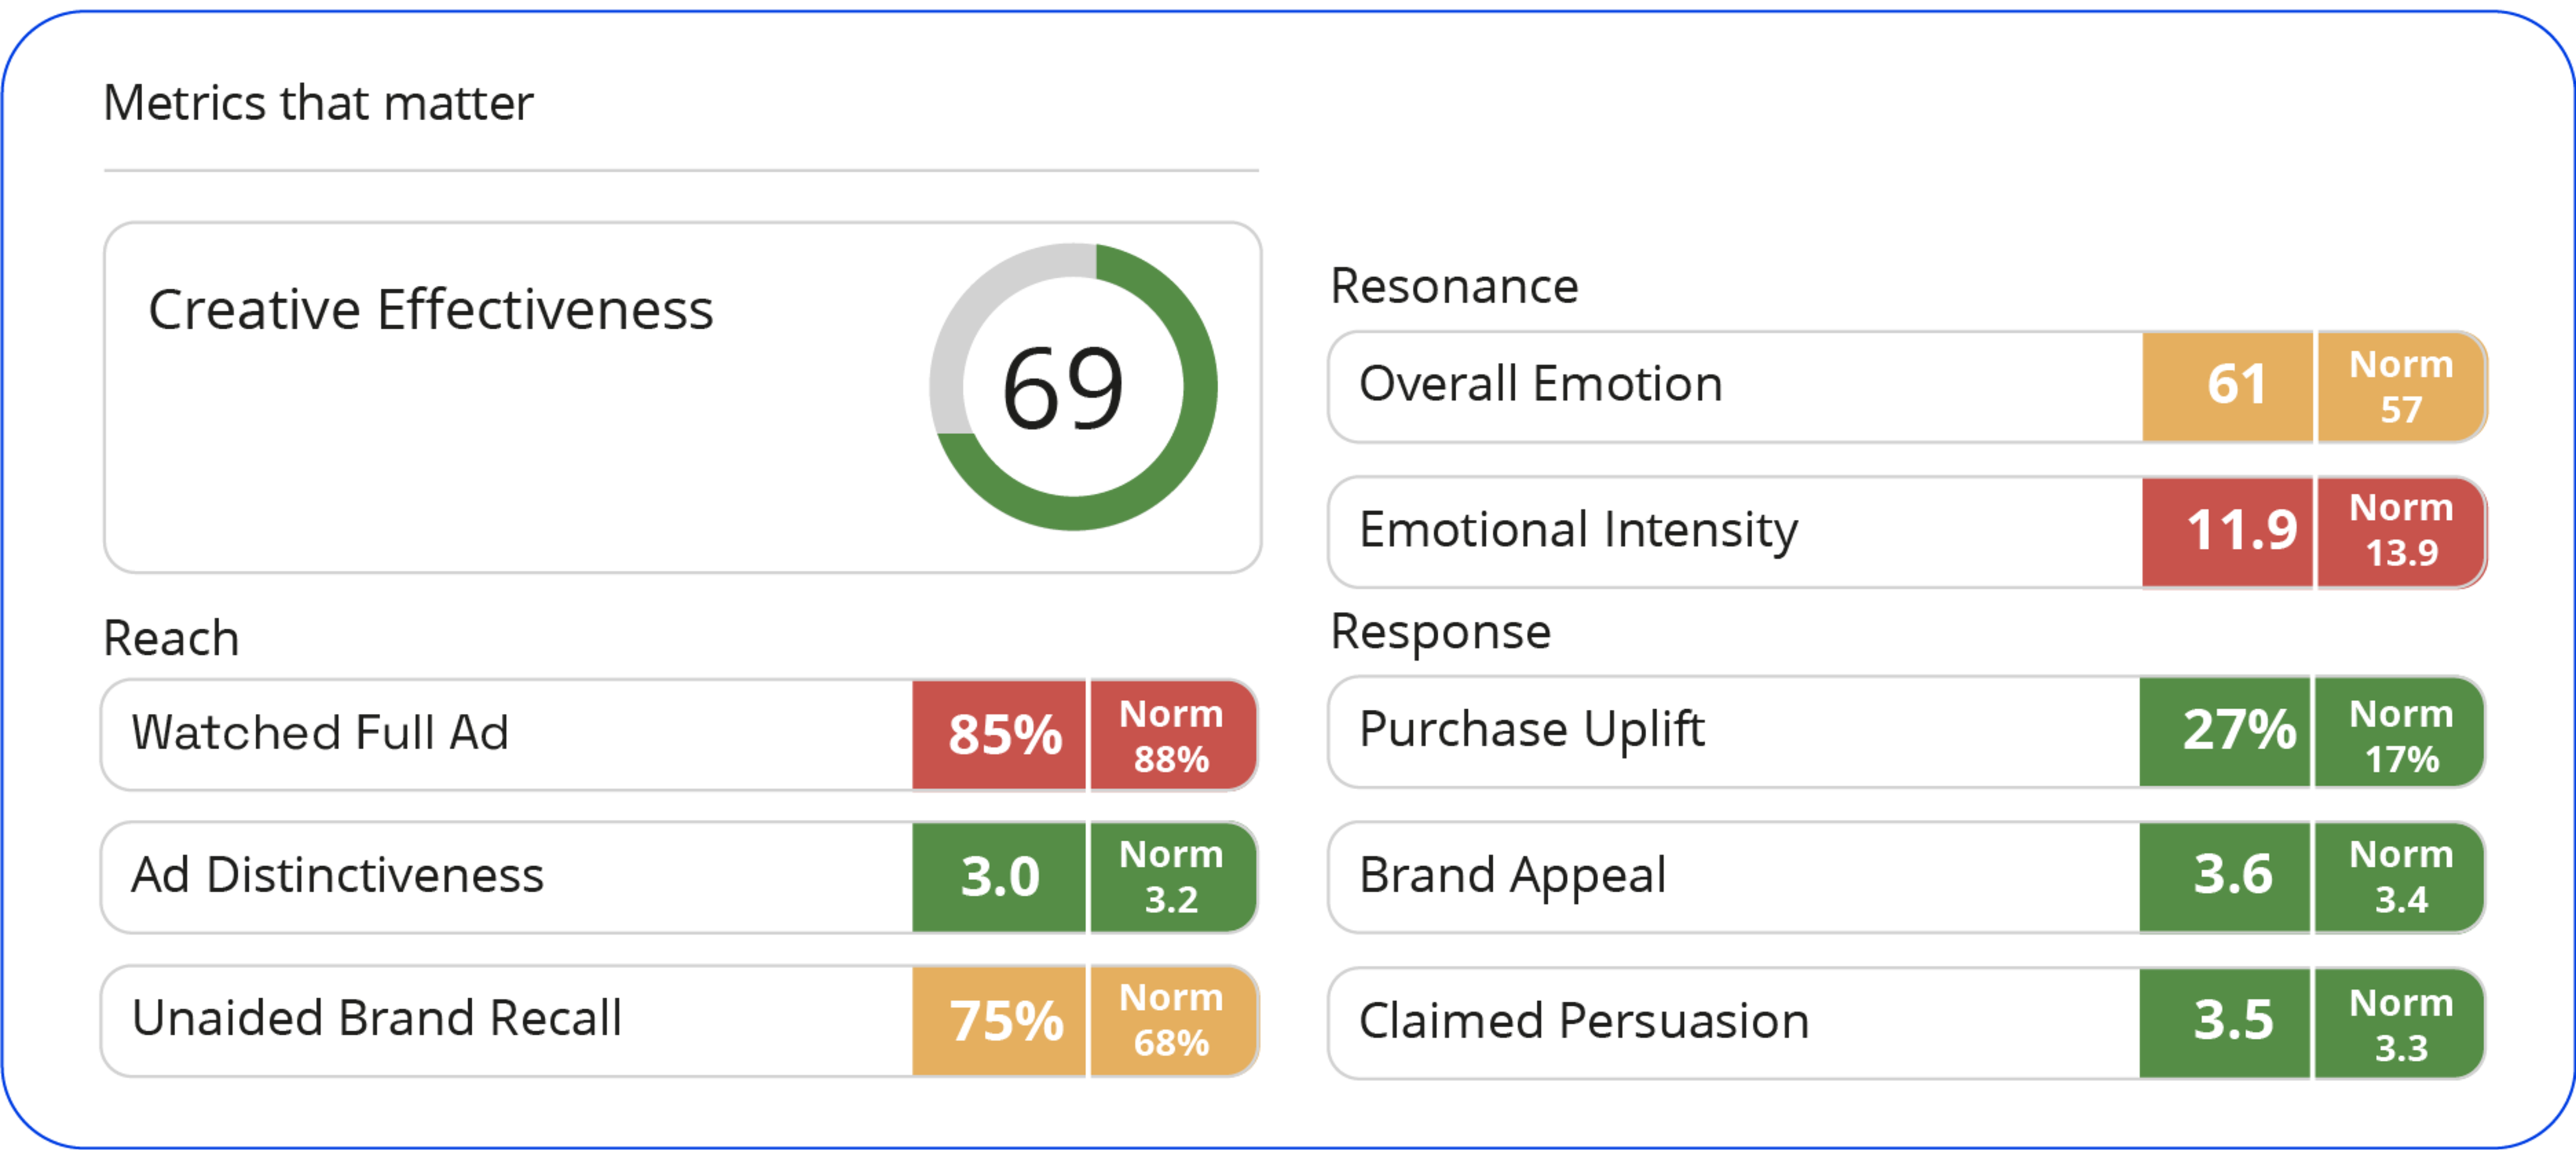
What you’re getting in the second image are benchmarks you can use to compare your ad against. The benchmarks help you understand whether each of these numbers is “good” or “bad” so you can make a decision about what to do next.
Let’s walk through a few of the most common benchmarks we see to help you get a picture of why they’re valuable to your consumer research.
Why researching ads early and often makes all the difference
Another key factor to learning what works and doesn't work for your audience is to test early and often. Read our article to learn more.
One of the first benchmarks you should consider is a category average — the average scores that concepts in a specific category have received. This is ideal for innovation concepts, as the way people engage with products in different categories varies dramatically.
It wouldn’t make sense to compare your dental floss concept against a benchmark that includes the performance of soft drinks, vodka, credit cards, hamburgers and mobile phone plans, for example. You wouldn’t get a lot of useful information from that comparison because those products are so different from each other.
It would make more sense to compare how consumers respond to other hygiene products. That will give you a meaningful comparison to help you understand how consumers really feel about your dental floss.
And when it comes to advertising, a category average can be useful when you want to ‘outshine’ the category. It can give you a relevant benchmark to beat so you can understand if you are getting better ROI than your competitors. It is particularly relevant for measures of persuasion/behavior change which can be more specific to the category.
Another high-level benchmark you could look at is a country average, which gives you average scores for an individual market. Country averages are often appropriate for advertising research — and especially for measures related to gaining attention — because your ads will be competing for the attention of the entire market. In fact, your ad is competing against everything for a little slice of attention!
Consumers may see your ad for your quick-serve restaurant immediately after a trailer for the latest summer blockbuster, or they may see it on Facebook while scrolling for news from their friends — so it can be helpful to understand how well your ad would breakthrough given this dynamic.
Why your data needs to account for cultural response bias
Another thing to keep in mind is cultural response bias. Read our article to learn the types as well as our insights on cultural response bias, backed by our own data.
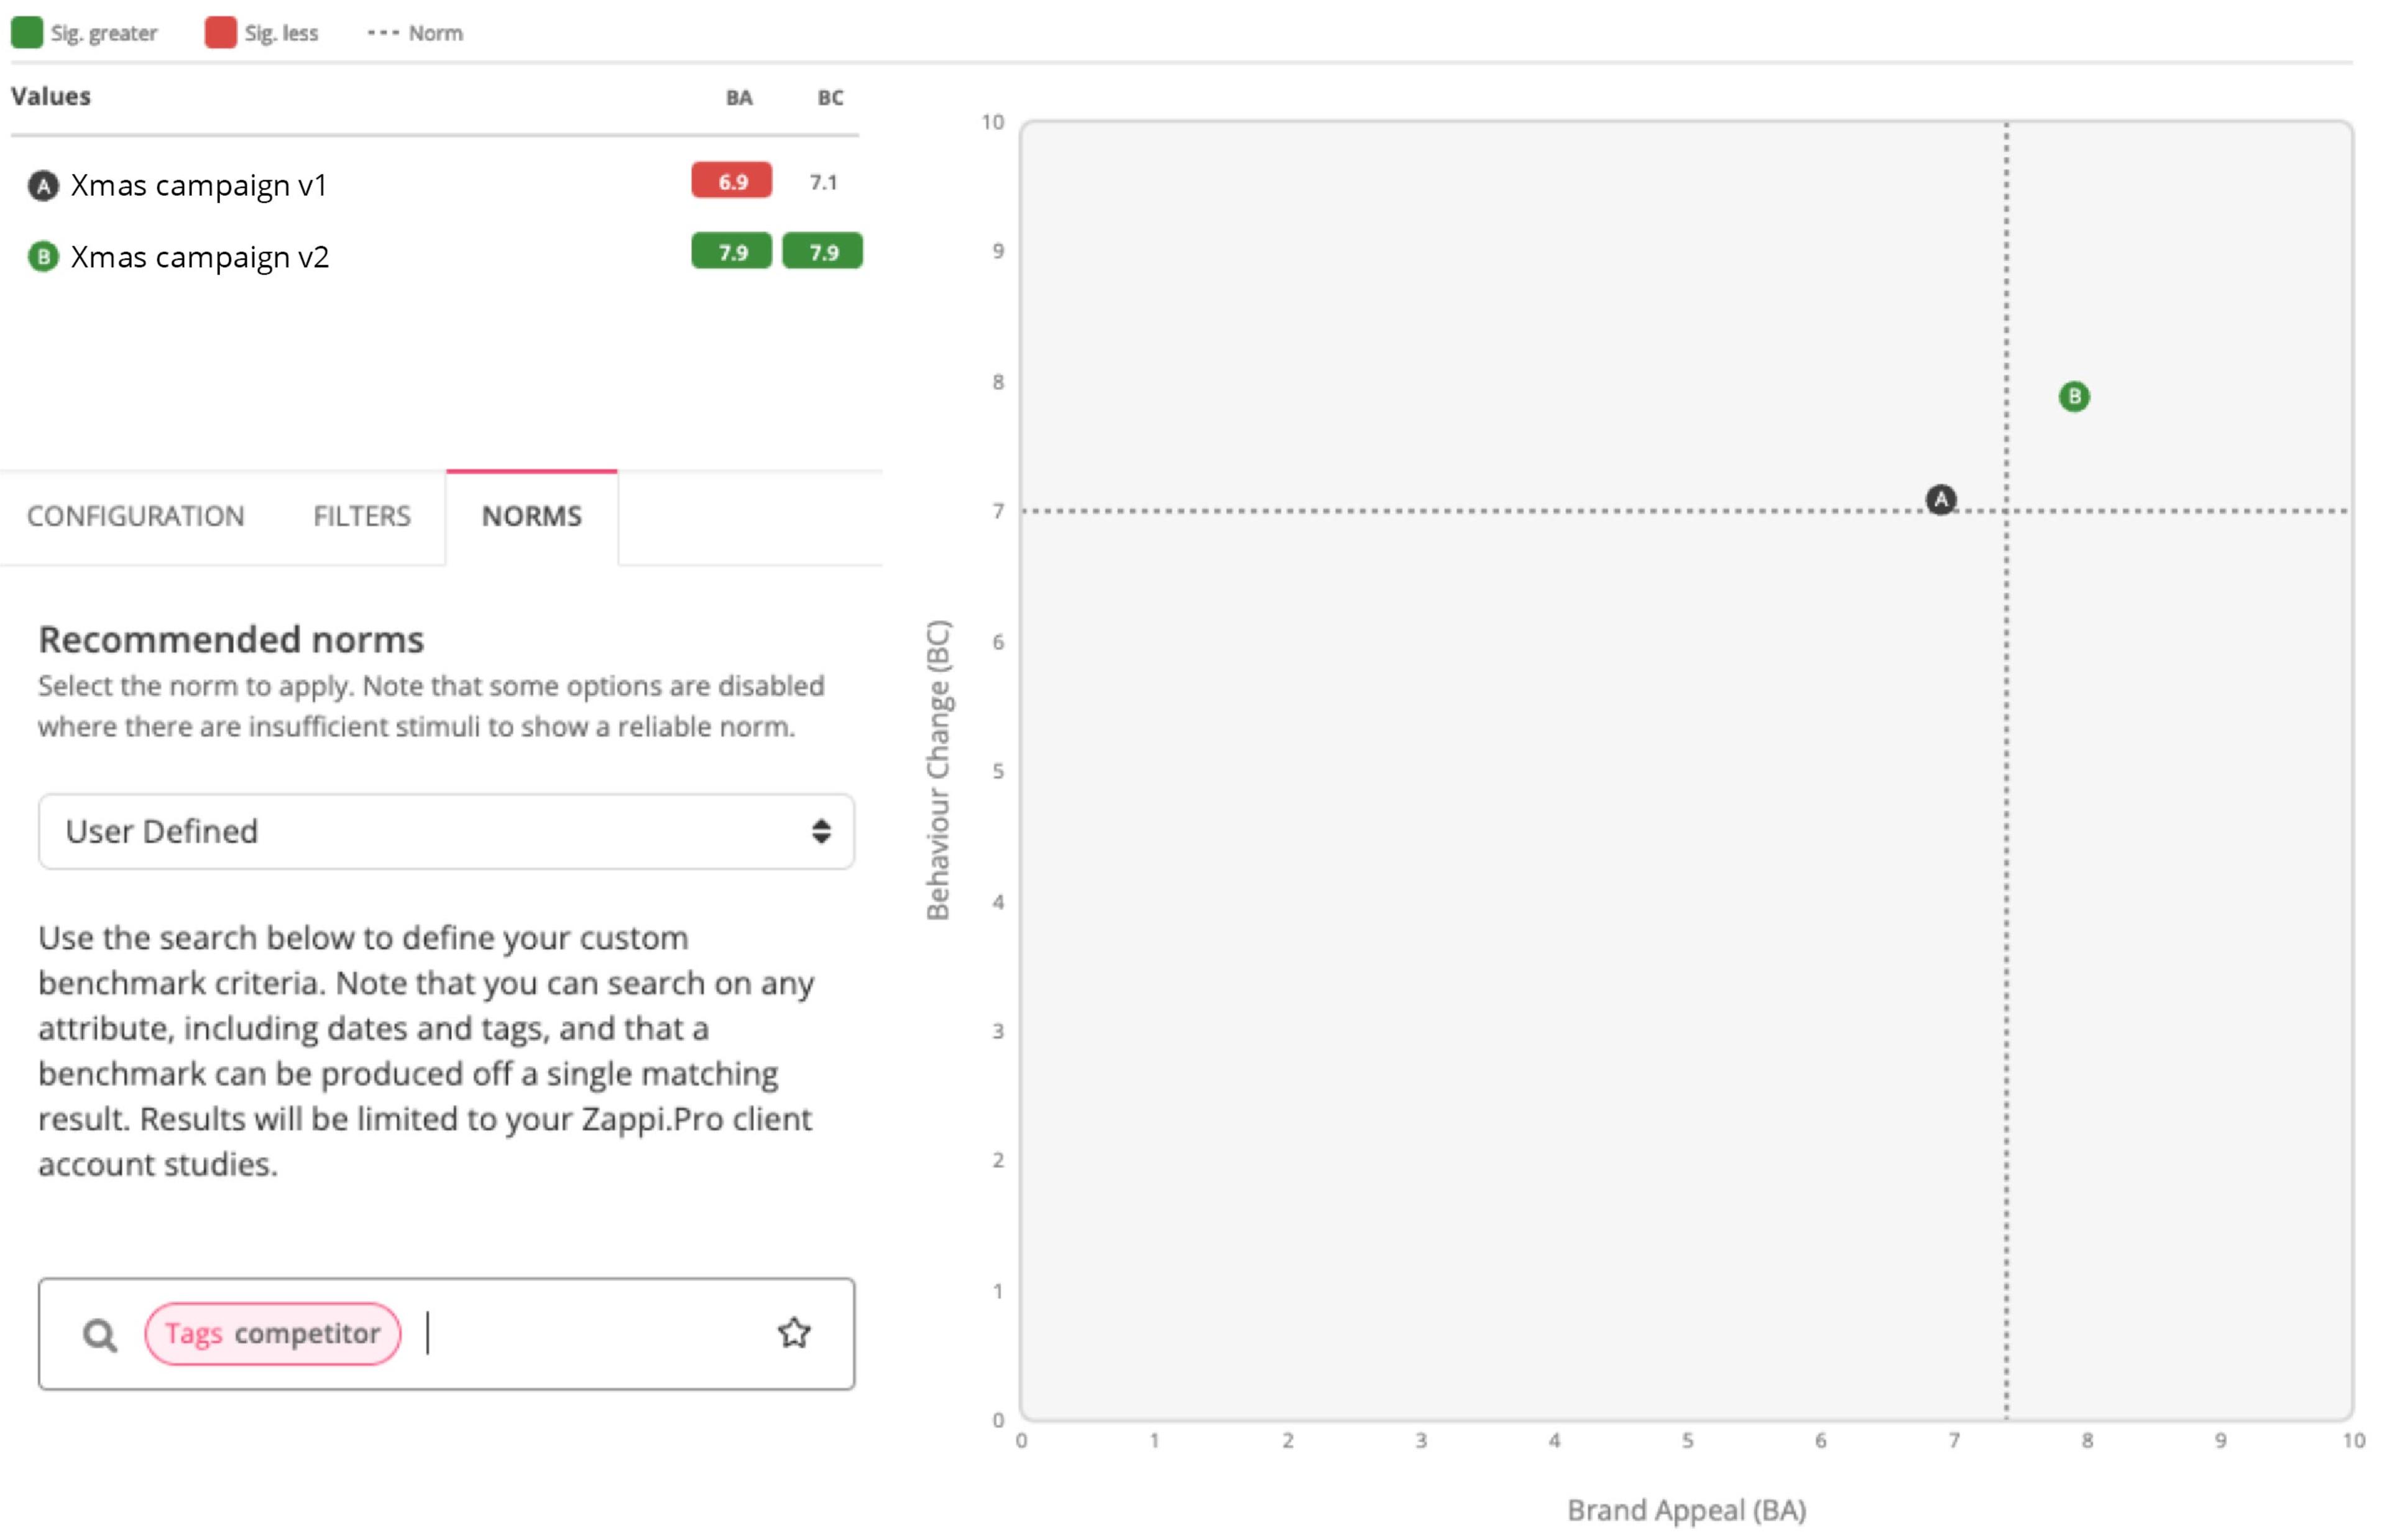
There might be times where you want to hone in on specific competitors, rather than a country or category as a whole — specifically in advertising. For example, if you’re trying to push yourself to beat a few key competitors’ ads that you view as particularly successful, you may want to create a benchmark that includes just the performance of those ads.
With each ad you research, you can compare against an average of your top competitors to see how your ad stacks up.
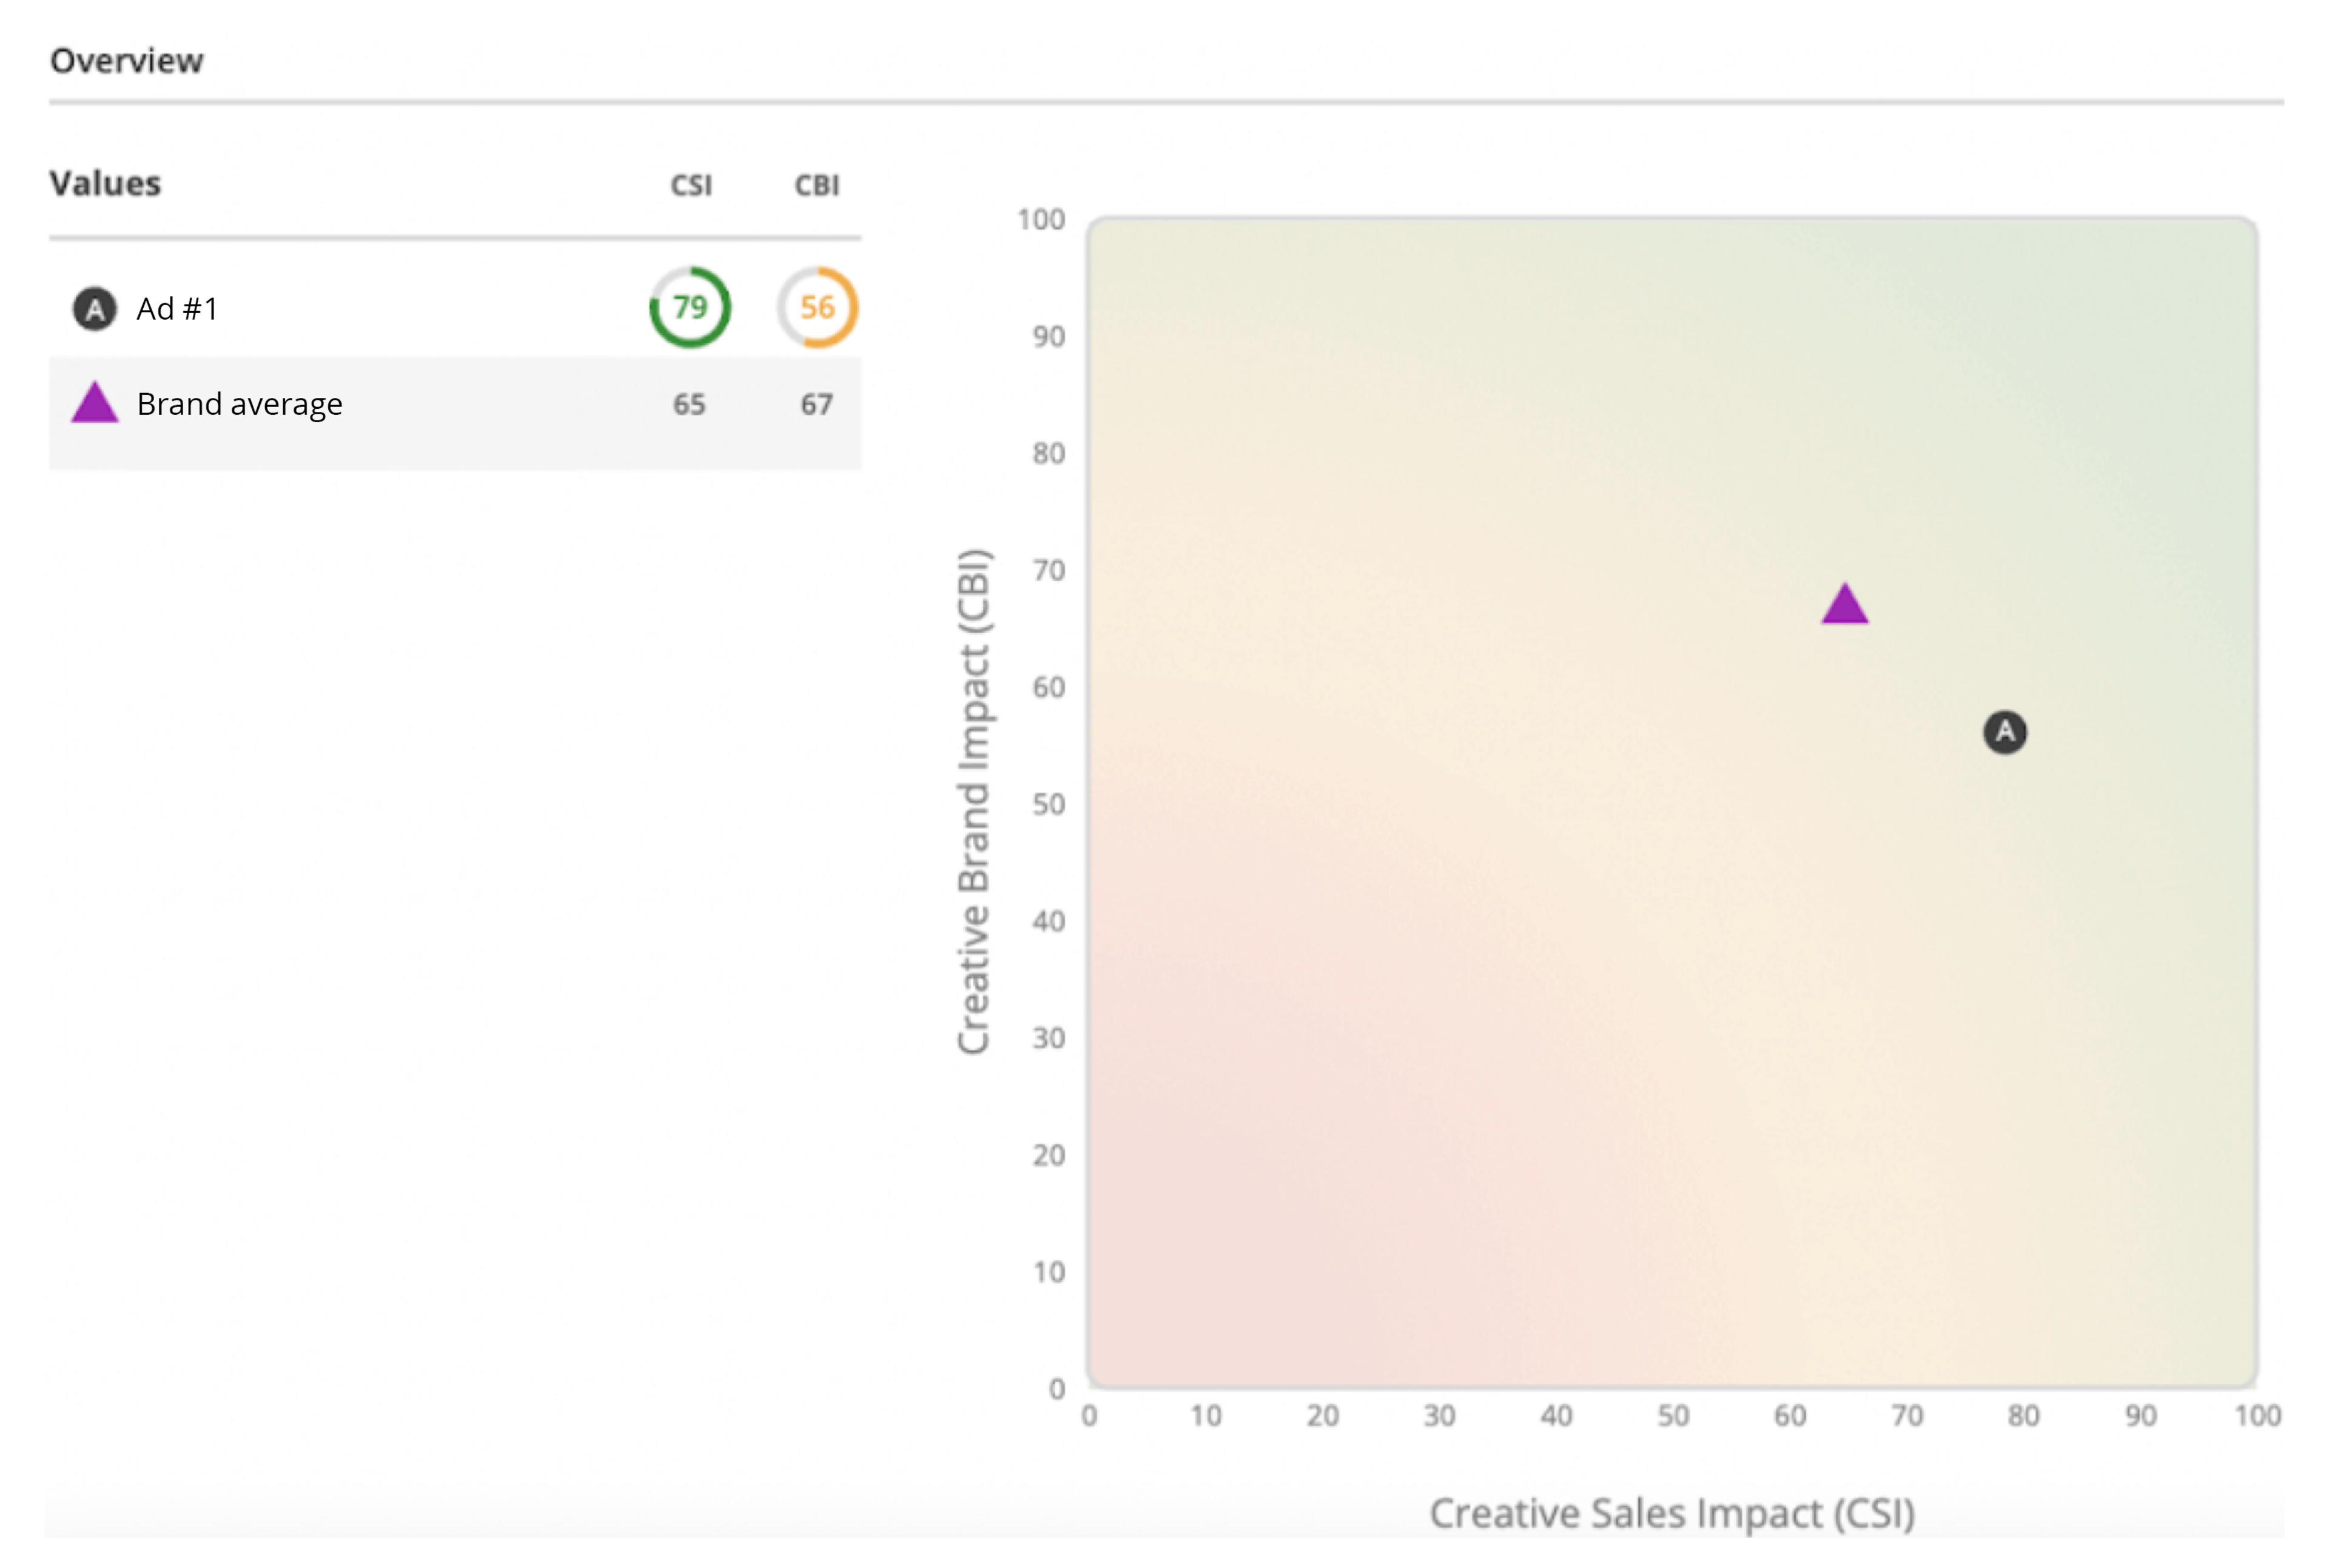
If you’re like the Zappi team, you’re always pushing yourself to improve. It’s not just about beating the competition, it’s about learning and growing so your ads and products get better and better over time.
To do that, it’s important to be able to compare each ad or concept to everything else you’ve researched in the past. That way you can know for sure how your idea compares to past work and create an ongoing cycle of improvement.
Some CMOs only talk about launching ads that are better than their previous work — so this comparison is often critical for communicating with the C suite.
Do you have one incredibly successful ad or product that you’re always trying to beat? If so, it can be motivating to compare each new ad or product concept against that “north star” creation.
And if you find something that scores better than that one winner, it should be an easy sell to get the organization bought into it!
This can be especially useful for innovation, as you know the sales impact of your past launches. You can easily compare against individual successful prior concepts to be sure your new concept is strong enough to be worth investing in. There’s significant investment associated with developing and taking a new product to market, so you want to be sure!

Finally, you'll likely find that different characteristics of ads or products help drive different responses.
If you’re investing in a celebrity for a new ad, you might want to benchmark against all your other ads that featured celebrities. That way you can be sure you’re using the investment in that celebrity wisely. Or you may have created a 20-second ad for Facebook rather than your usual 10 second ones. You might want to compare this longer ad to your shorter ones to see if it's strong enough to engage.
In another example, you might want to compare this year's special 'holiday' flavor to holiday flavors launched over recent years to check it will be as well received. Or you could compare this “'limited edition flavor” to previous “limited edition flavors.”
You can compare your ad or concept against any group of ads and concepts with any shared characteristics — whichever characteristics matter to you!

Let’s look at an example. Over the years, the intimate wellness team at Reckitt tightened its strategy to target a specific core audience for each of its brands, rather than the general population as a whole. Those audiences are made up of people who share similar attitudes toward sex — not demographics.
But that strategy shift meant that the team didn’t want to compare new product ideas against a general hygiene category average. They needed to understand how a concept compared to others in the intimate wellness category, but specifically among the psychographic audience for each brand.
So the team built their own benchmark within the Zappi platform. This benchmark was built by testing concepts with the attitudinally-defined audiences for each of its brands. That way, each new concept’s performance can be compared against a meaningful benchmark so it's easy for the team to understand whether a concept is worth moving forward or not.
Reckitt has been able to use the learnings, with the help of the benchmark, to confidently shape the innovation pipeline for each of the brands over the next five years.
Building an innovation pipeline with Reckitt
Discover how Reckitt and Zappi worked together to create a meaningful benchmark for the Intimate Wellness team to use to make decisions about which concepts to move forward with.
The benchmarks you use will depend on your goals. Before you do any research, think about what you want your ad or product to do for your business and use that to determine what will help you judge whether it's a success. It is likely that you will benefit from using more than one.
The beauty of an automated platform like the Zappi platform is that you have the flexibility to change your benchmark on the fly.
For example, in an upcoming ad campaign you might have a goal to have consumers associate your brand with a specific value. In that case, you would compare this ad against many of your historical ads to see if this one drives that brand association better. But you’ll also want to understand if it will gain attention at all. So should also compare attention measures against the total country benchmark.
With Zappi, you don’t have to wait to get that data back each time you want to compare against a different benchmark. You can simply switch views with the click of a button in the platform.
Let’s recap what we’ve covered in this blog post:
Benchmarks are a critical, yet often underrated, part of your consumer research
They help you interpret your data so you can better validate and optimize your ideas
Think about your benchmarks and what each will tell you/what decision it will influence before you start your research
Find an insights platform that allows you to compare to multiple benchmarks on the fly so you can drill into your data whatever way you chose without delay
Reach out to us
Let us show you how Zappi can help you get the right benchmarks to help you create ads and products people love.


