👋 Introducing Amplify AI: Fast brand signals for social video
LEARN MOREIntroducing the Zappi Quality Score: Helping the research industry fix data quality

The market research industry has a problem.
Survey research remains an important tool that most companies use to understand their consumers. And these companies expect their survey data to always reflect the genuine attitudes and perspectives of consumers.
But the move to online research has lowered the costs associated with sample collection — and there has been pressure to continuously lower those costs over time.
At a certain point, prices can’t go any lower without sacrificing quality. That’s where we are today.
We often find that respondents have breezed through a survey without offering their real thoughts just to get compensated. Or that data comes from bots, rather than real people. As an industry, and especially at Zappi, we have built systems to screen out these bad quality responses.
But we expect the situation to worsen with the rise of AI tools that can trick us into thinking responses come from humans.
As an industry, we can’t sit back and wait until this becomes an even larger problem — we have to act now.
We've been committed to maintaining the highest data quality since the beginning of Zappi, and we've been at the forefront of anticipating the rise in fraudulent bot activity.
As a result, we have developed an innovative, industry-leading approach to ensure that the insights we provide are reliable and trustworthy. We hope this proactive approach can help lead the industry through this problem.
We have developed the Zappi Quality Score, which looks at 14 signals of quality at an individual respondent level and creates a composite score to measure the overall quality of a respondent.
It is calculated after a respondent has finished a survey to look holistically at all of the signals of quality — rather than each in isolation.
With this quality score, we can look across respondents and projects to continuously ensure and improve the quality of our data. It allows us to:
Group markets according to confidence in quality
Compare sample providers
Design better surveys
Detect bots and fraudulent respondents
🎙️ Why sample consistency is everything
Check out our podcast episode that addresses how to tackle the data quality crisis in the insights industry.
Our first major deployment of the Zappi Quality Score has been to look at the quality of data we’re collecting across markets.
This exercise immediately confirmed what we had already suspected: The sample we collect across markets varies in quality, and in some markets the data is of poorer quality in general.
This gives us a starting point for addressing the problem, because the quality score gives us something we’ve never had before: A metric that quantifies sample quality across markets.
When we can put a number behind it, we can identify which markets need improvement and then measure our efforts to improve them over time.
According to the Quality Score, each market falls into one of three tiers:
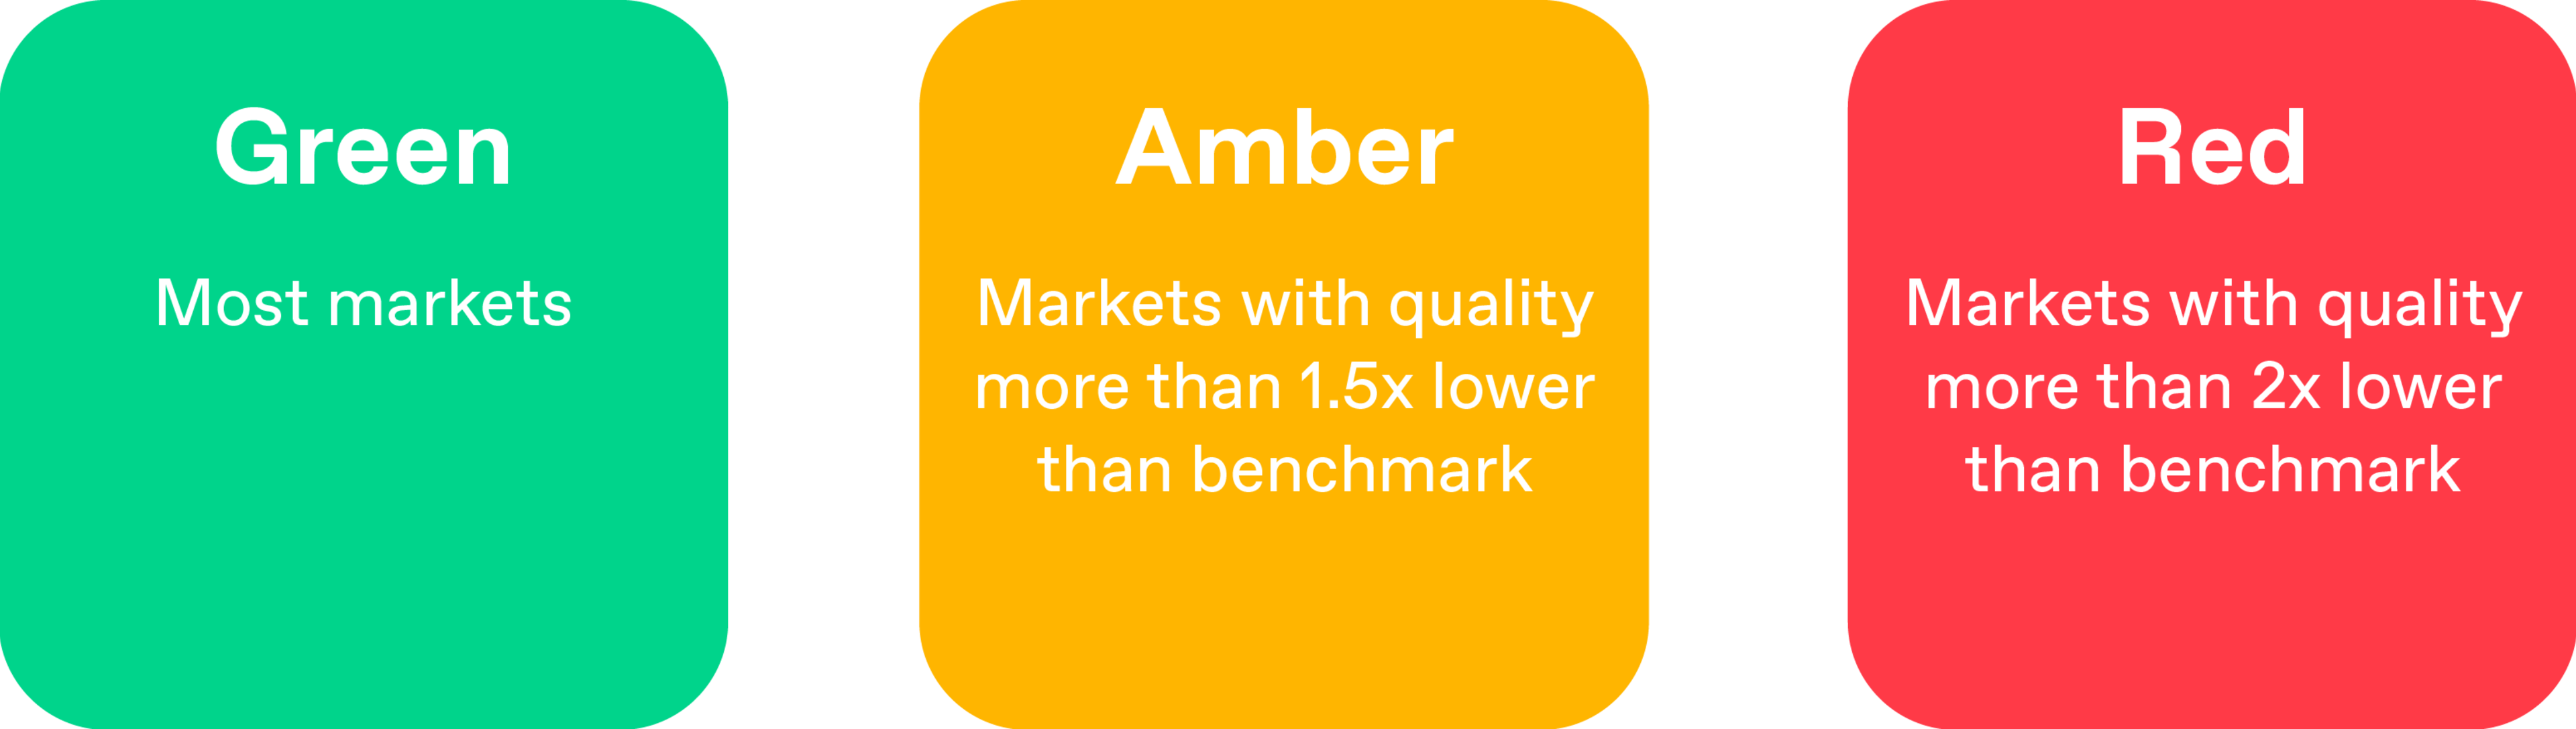
You can always view the list of which markets currently fall into each tier in our Knowledge Base.
So what are we doing to improve quality in amber and red markets?
First, Zappi’s market leading automated quality checks remain in effect across markets to catch and automatically remove bad quality responses.
But in amber and red markets, we have added an extra layer of human checks. A consultant manually checks every project and every response according to a set of criteria we have outlined.
The consultant removes poor quality responses from the dataset and refields the study to ‘top up’ missing data. In red markets, the responses are checked a second time, followed by a final round of refields.

Naturally, turnaround times for amber and red markets are now a bit slower than green markets. But we have communicated with our customers that this is due to quality issues in those markets, and we are taking the actions we have to take to ensure they receive quality data for those markets.
An added benefit of the manual checks is that they provide a training set of data we can use to train our automatic checks to detect more bad quality responses in the future. And once that's done, we get back to quality at super speed even in the difficult markets.
We want our customers to feel confident making decisions with data from any market we offer.
4 types of bad verbatim responses: Why they 'Shall Not Pass' at Zappi
Check out our article on how we combat bad quality responses.
Through our initial efforts in amber and red markets, we’ve seen a 34% reduction in bad responses in just a few months,
And as we continue to improve our automatic quality checks with what we’ve learned from this work, we’ve caught five times as many bad responses automatically in one new market.
Analyzing quality by market is just one way we can use our quality score. We will also use it as an additional check on the solutions we offer on the Zappi platform to ensure each one is consistently delivering high quality data.
We are also looking at quality by each of the suppliers we work with so we can work together to improve quality at the source.
Quality is not a one-time fix. It’s something that we take very seriously and are always looking at ways to improve. We’re proud of the work we’ve done so far with the Zappi Quality Score, but there is still much to do at Zappi and in the rest of the industry. We hope to inspire others to work with us to address this industry-wide problem.
Let's chat
Reach out to us to learn how Zappi can help you bring consumer insights into every step of your creation process.


