Contribute your thoughts to our annual insights report 💬
TAKE A QUICK SURVEY5 steps to better quality consumer insights data
The vast majority of innovations fail. At least half of advertising spend is wasted.
We’ve all heard the stats and expert quotes on these topics, so we don’t need to repeat them here.
Because at the end of the day, the stats don’t matter. What truly matters is that your innovations succeed. That your advertising money is well spent. And who decides whether your innovation and advertising succeeds or fails? Your consumers.
If you bring consumers into your creation process early and often, you can use their feedback to shape your ideas. That’s the only way to know that your ads and products will be winners when they make it to market.
To do this, you need to talk to real, engaged consumers about their opinions and reactions to your ideas. This feedback is the magic key to making smart decisions that grow your brand.
But when you act on bots or rely on fraudulent, dishonest, or uninterested respondents, you run the risk of making the wrong decision. These types of responses just increase noise and reduce statistical meaning.
4 types of bad verbatim responses: Why they 'Shall Not Pass' at Zappi
Learn more about the effect of poor consumer responses and bad verbatims and what we're doing to combat it.
Unfortunately, that’s the reality we’re living with today. Declining data quality in survey research is an ever-worsening industry challenge. The problem stems from two key areas:
Respondents are frustrated with poor surveys, poor pay and poor experience, so they don’t fully engage in surveys.
Survey farms and bots fill surveys credibly and faster than ever. Worse, in late 2022, our industry saw a massive change with large language models (LLMs) like ChatGPT creating new types of poor quality to go undetected easier than ever before.
Technology is the primary source of the problem here. But technology can also help us find a solution.
At Zappi we have always been committed to putting quality at the center of everything we do — across every step of the research process — as opposed to an afterthought overtaken by speed and scale.
This philosophy has allowed us to constantly check, improve and keep reacting to changes in the market to continuously improve quality checks and provide meaningful data any insights department can act on. In recent months, we have gone a step further by creating a systematic way of measuring and improving quality on an ongoing basis.
The process we’ve taken covers five main steps:
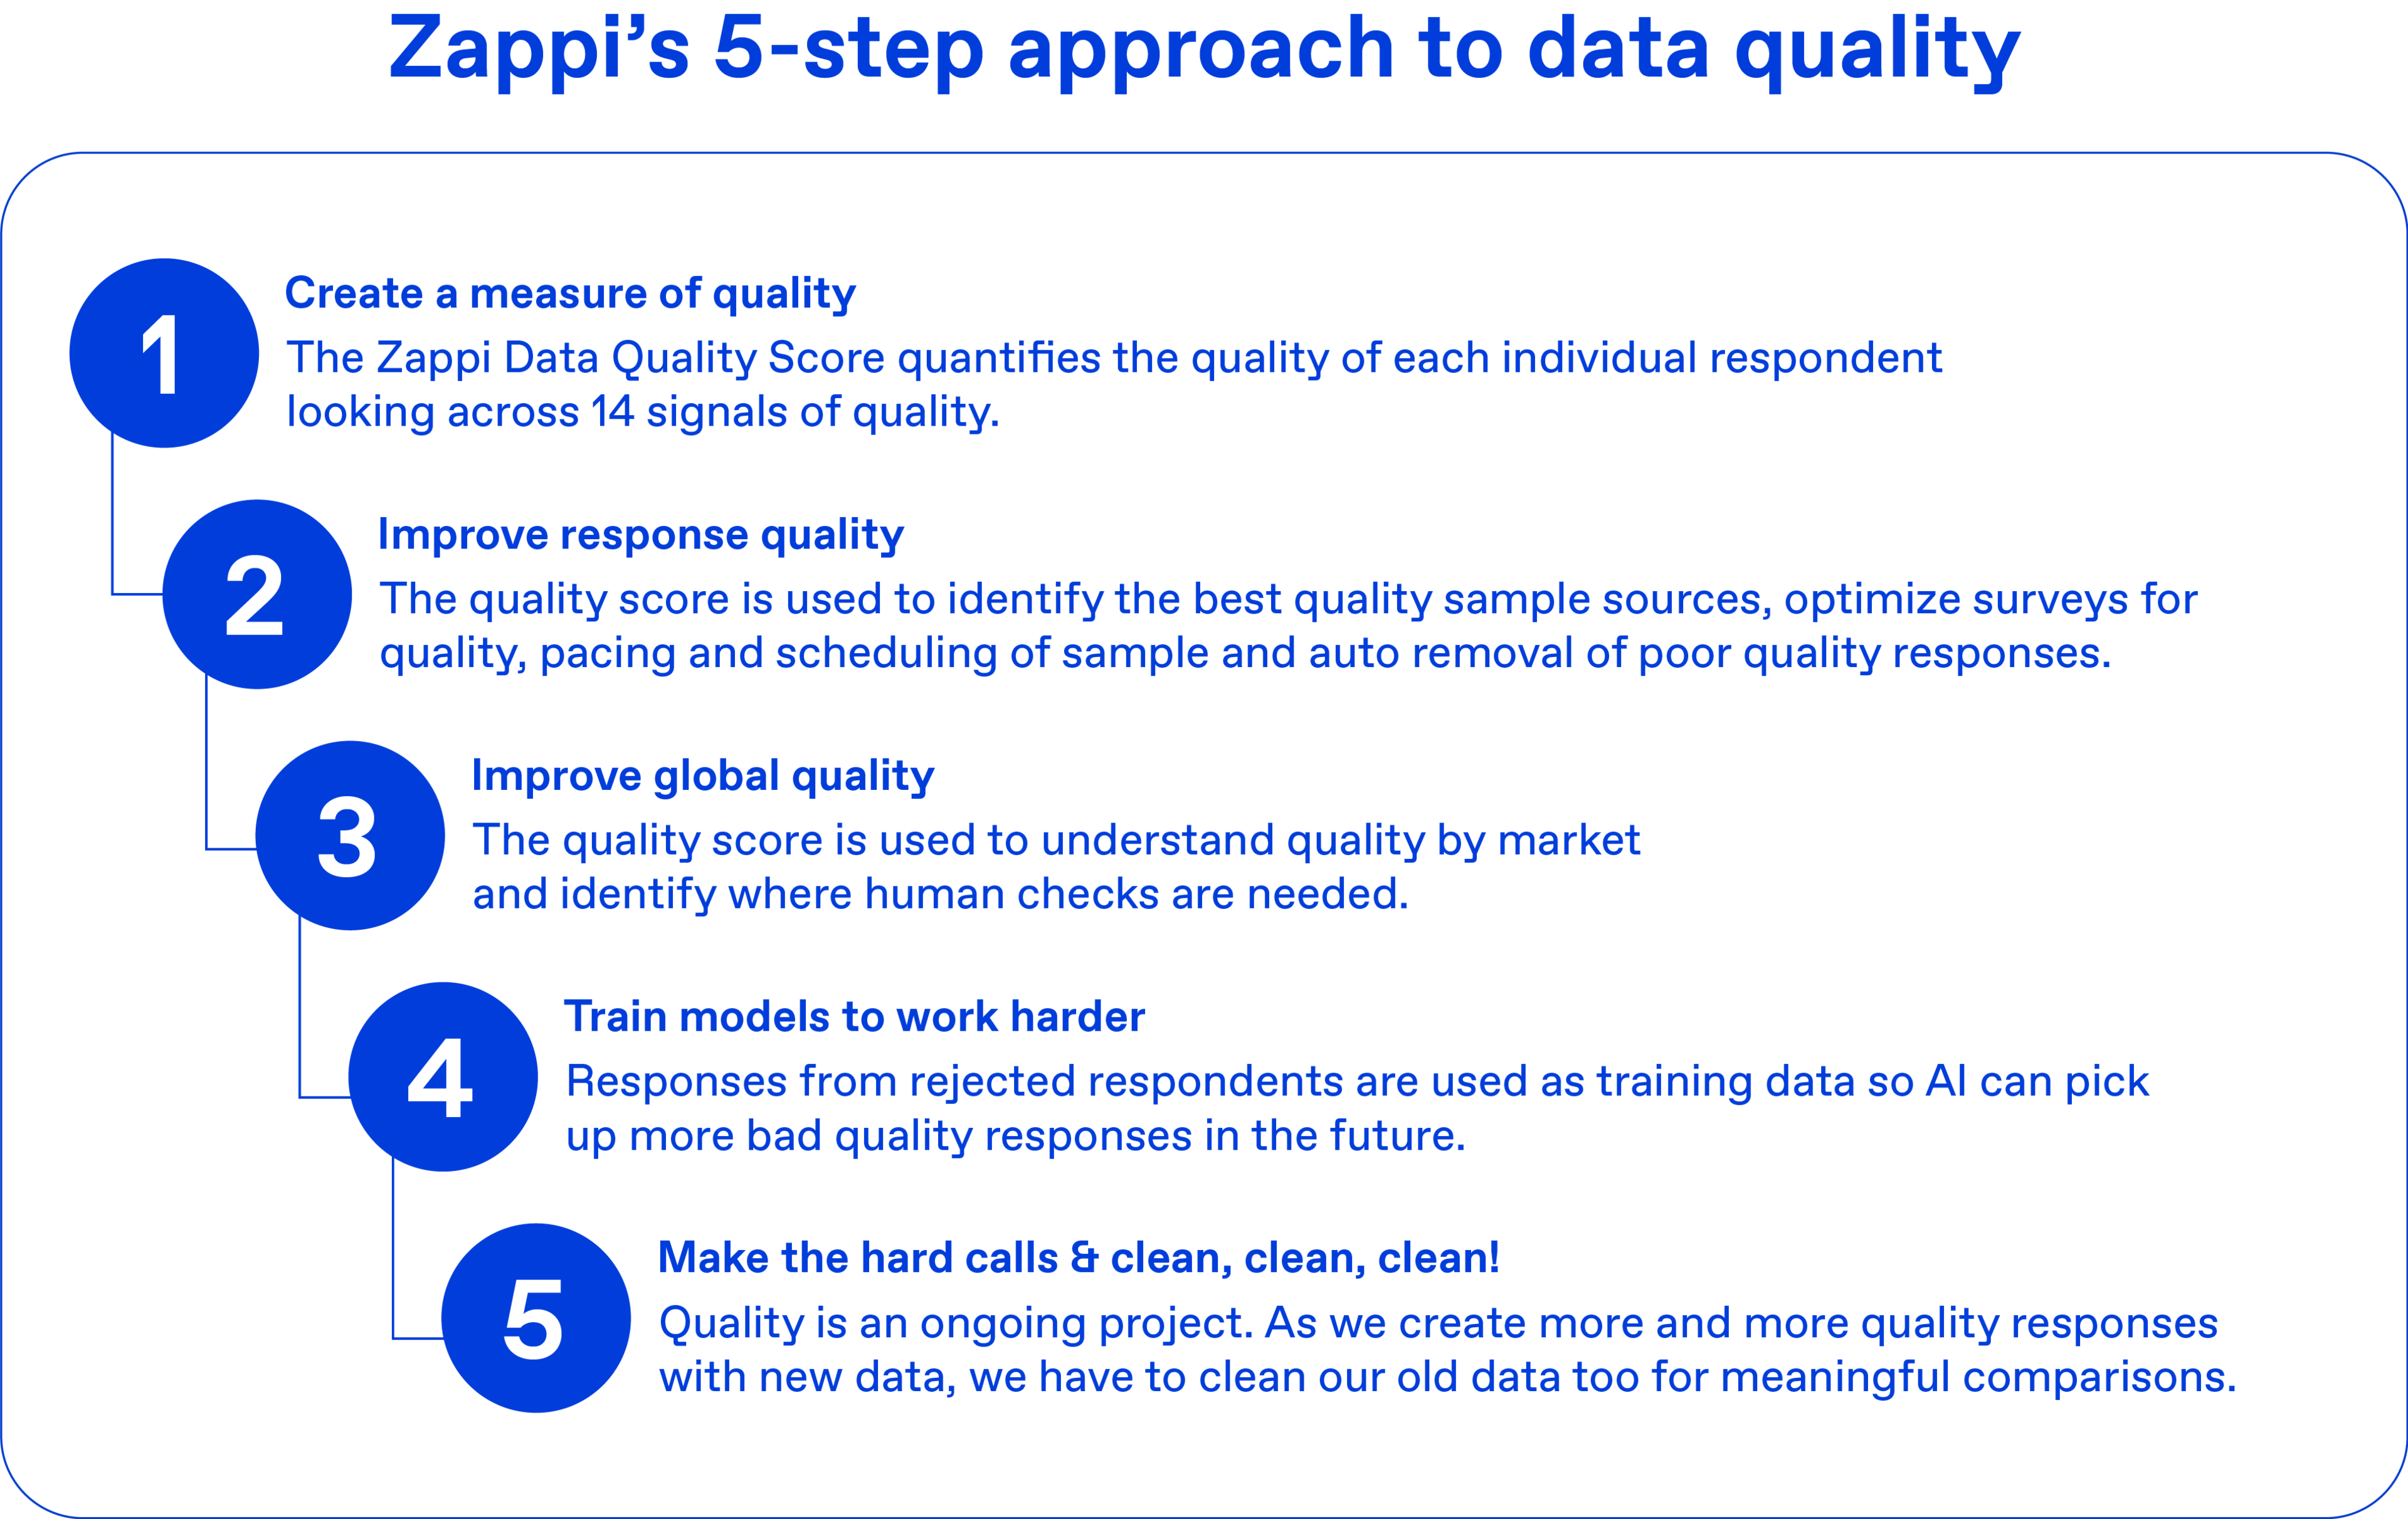
Let’s walk through each of them. It might give you some ideas to ensure quality across all your research.
It’s tough to know if you’re improving something if you can’t quantify it. If you’re looking to tackle data quality, measurement is the place to start.
We developed the Zappi Quality Score to help us measure quality. It looks at 14 signals of quality at an individual respondent level and creates a composite score to measure the overall quality of a respondent (including checking on gibberish/nonsense, straight-lining across responses, richness of response, repetition, irrelevant or offensive responses).
It is calculated after a respondent has finished a survey to look holistically at all of the signals of quality — rather than each in isolation.
With this score in place, we can look at quality at a respondent level, but also aggregate those scores to look at quality by market, by Zappi solution, by data provider, etc. Which leads us to…
The next step is to use the metric to improve response quality — and measure improvement over time.
At Zappi, we’ve analyzed our quality score data across our solutions and data providers, which has given us clear actions we can take to improve quality. For example, we are working to:
Identify which sample providers offer more engaged, real responses and adjust our sample provision to include more of the quality sources and exclude poor quality sources from our research. Pay appropriately for responses to encourage the right engagement.
Identify lower-quality solutions and change survey length, structure, and interactions to improve the experience.
Determine the most appropriate times of day for surveying, and only collect responses during those times.
Introducing the Zappi Quality Score: Helping the research industry fix data quality
Learn more about our innovative, industry-leading approach to ensure that the insights we provide are reliable and trustworthy
One thing we’ve learned after operating in global markets for the last decade is that not all markets produce the same quality data. So in addition to improving response quality everywhere, there are key markets that need more attention to bring the quality up to the levels needed for decision making.
With our quality score we have been able to create three tiers of the markets we work in (green, amber and red) based on the quality of responses we receive from those markets. You can always view the list of which markets currently fall into each tier in our Knowledge Base.

While all of our markets are subject to our sophisticated automated quality checks, we’ve learned that the amber and red markets need extra help. So we’ve added a layer of human checks where a consultant manually checks every project and every response according to a set of criteria we have outlined.
The consultant removes poor quality responses from the dataset and refields the study to ‘top up’ missing data. In red markets, the responses are checked a second time, followed by a final round of refields.
With this approach, we can ensure that all of our markets produce the same high quality data.
The bad quality responses that the consultants removed from our data set still have value to us — we can use them to train our algorithms to pick up those kinds of bad quality responses in the future.
Our automated checks are designed to automatically identify and remove poor quality or ‘bot’ responses: flagging fake respondents, keeping unique respondents only, understanding indicated location, and monitoring whether respondents are engaged or speeding through.
But we need to continue to improve our algorithms as circumstances change and advances in AI introduce new risks. Training our algorithms on the bad quality data our human checks have flagged is a perfect way to help them learn.
Finally, quality must be an ever-evolving area. As an industry, our work is never done. That means that we have to make sure that all the historic data and norms are held to the same standards as all the new data coming in.
At Zappi, our data asset has huge value for learning and comparisons. It has to be subject to the same rigorous quality as the new data. This requires ongoing maintenance and cleaning, but it’s worth it!
Quality is not a one-time fix. It’s an ongoing process of learning, iterating and improving. We hope that being transparent about our approach to improving data quality will help other players in our industry improve their data quality as well.
Talk to us
Interested in learning how Zappi can help you bring consumer insights into every step of your creation process? Let’s talk.


